Sensors & Gateways
The Sensors & Gateways page provides a fleet-wide view of every sensor and gateway in your organization, organized by site.
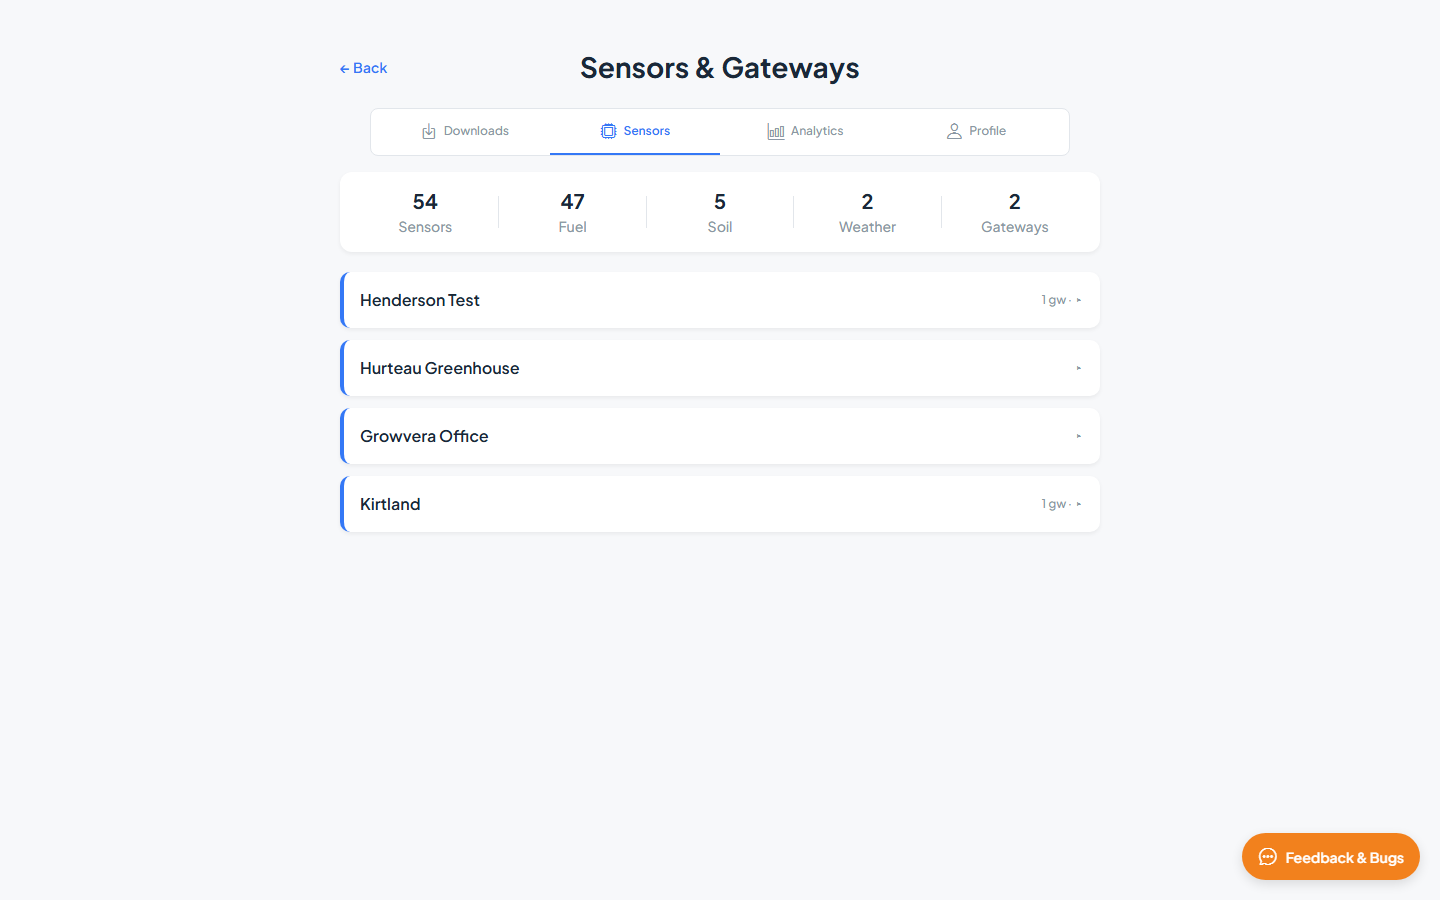
Fleet totals
The summary strip at the top shows counts across your deployment:
| Count | Description |
|---|---|
| Sensors | Total sensors in the organization |
| Fuel | Live and dead fuel moisture sensors |
| Soil | Soil moisture sensors |
| Weather | Weather stations |
| Gateways | LoRaWAN gateways |
Sites list
Each site appears as a collapsible card. Click a site to expand it and view its gateways and sensors.
| Control | Description |
|---|---|
| Gateways | Gateways assigned to this site. Click a gateway card to show its metadata. |
| Sensors | Sensors at this site. Click a sensor card to open its detail panel with metadata, attributes, and installation photos. |
| Fuel, Soil, Weather chips | Filter the sensor list by type. Click a chip to show or hide that category. |
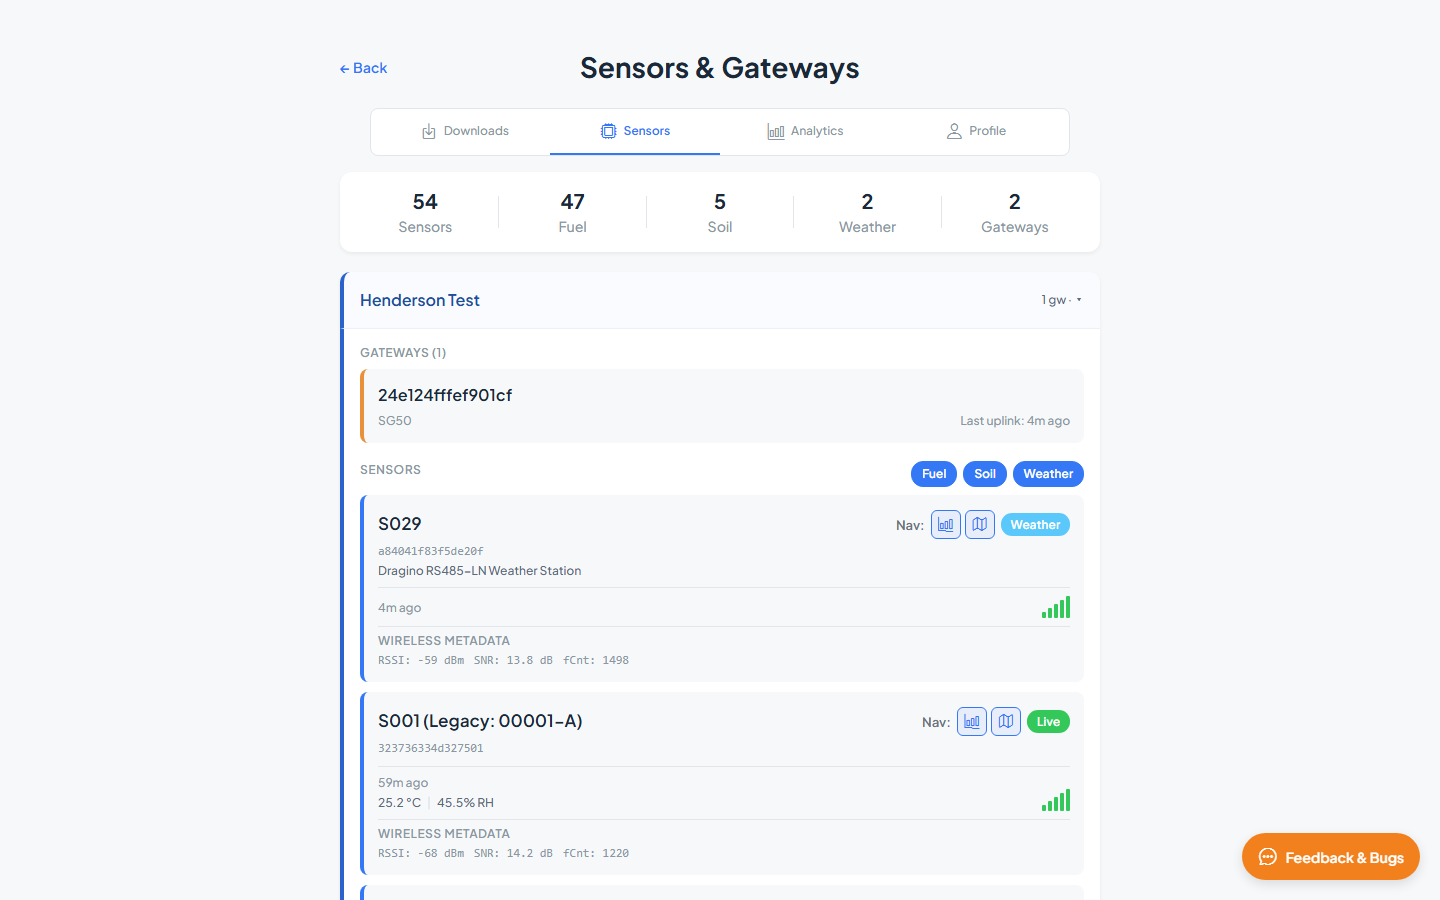
Gateways
Each site lists its gateways under a Gateways heading.
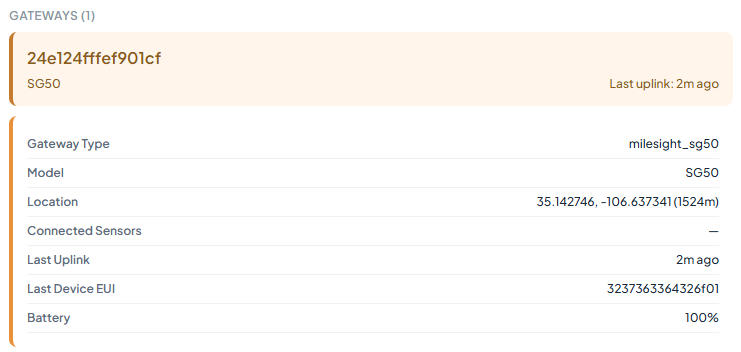
Click a gateway card to expand its details:
| Field | Description |
|---|---|
| Gateway Type | Hardware type identifier |
| Description | Optional description |
| Model | Gateway model (e.g. Milesight SG50) |
| Location | Latitude, longitude, and altitude |
| Connected Sensors | Number of sensors reporting through this gateway |
| Last Uplink | Time since the gateway last received data |
| Last Device EUI | Most recent device that uplinked through this gateway |
| Battery | Gateway battery level (if available) |
Sensors
Sensors are listed below gateways within each site.
Click a sensor card to open its detail panel.
Sensor details
The detail panel shows identification, link status, location, and installation photos. Use the Map and Analytics icons in the header to view this sensor on the map or open its charts — measurement values are not shown on this page.
| Section | Description |
|---|---|
| Header | Sensor alias (e.g. S029), device ID, and hardware model or description |
| Type badge | Fuel, Soil, or Weather |
| Last update | Time since the most recent uplink (e.g. 7m ago) |
| Signal indicator | Visual signal strength from the last transmission |
| Nav icons | Jump to this sensor on the Map or in Analytics |
| Wireless Metadata | RSSI, SNR, and frame counter (fCnt) from the last uplink |
| Sensor ID | LoRaWAN device identifier |
| Type | Sensor category |
| Assigned Site | Site this sensor belongs to |
| Location | Latitude, longitude, and altitude (m) |
| Height Above Ground | Mounting height in meters |
| Installation photos | Close-up, Far, and Sky thumbnails with capture date, when available |
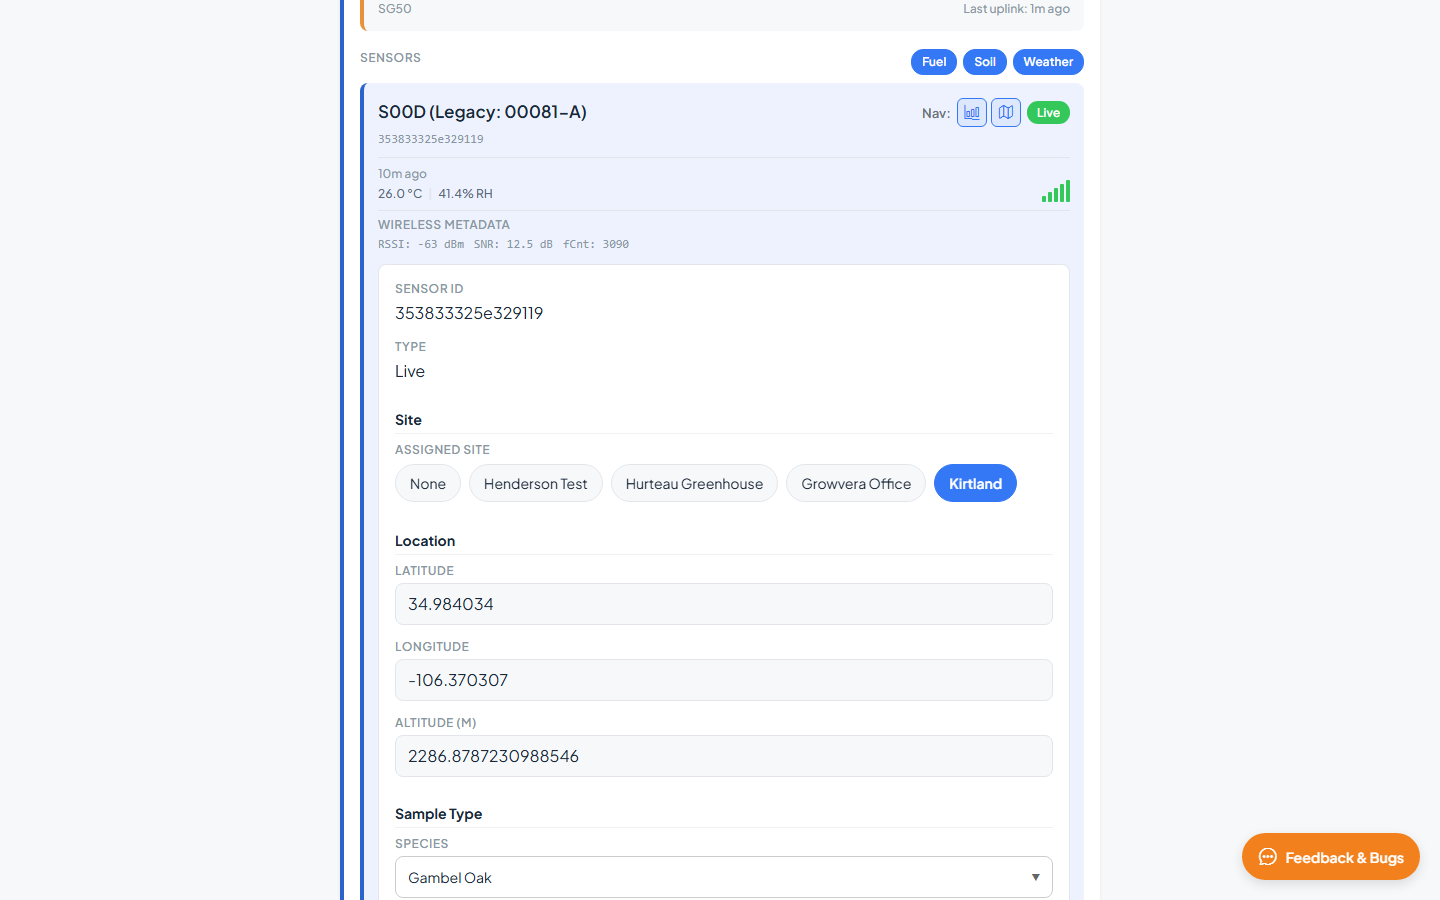
Edit Sensor
Click Edit Sensor to update sensor metadata, then Save or Cancel.
| Field | Description |
|---|---|
| Assigned Site | Site this sensor belongs to |
| Location | Latitude, Longitude, Altitude (m) |
| Sample Type | Species (live fuel), fuel code (dead fuel), or soil type and depth (soil) |
| Multi-Probe Depths — SDI-12 (soil) | Depth settings for multi-probe soil sensors |
Installation photos
When present, installation photos appear at the bottom of the sensor detail panel:
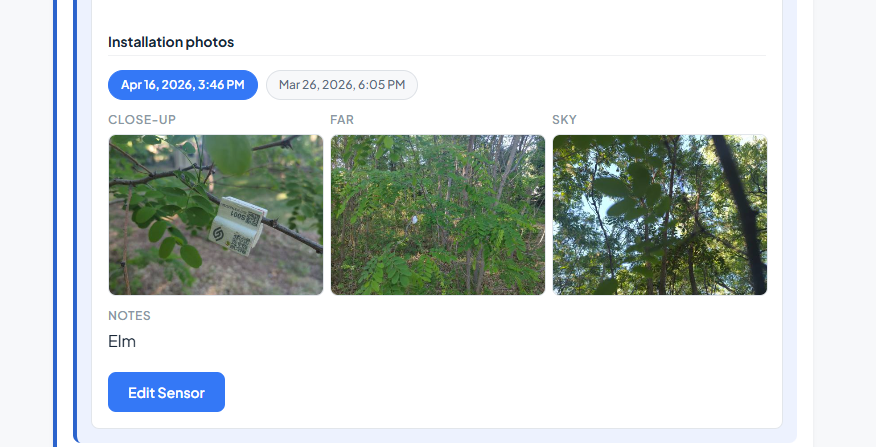
| Photo | Description |
|---|---|
| Close-up | Close view of the sensor installation |
| Far | Wider view showing surrounding context |
| Sky | Upward view for canopy or sky exposure |
Click a thumbnail to open the full-size image.
Related guides
- Map & Monitoring — view sensors on the interactive map
- Analytics — chart sensor data over time