Analytics
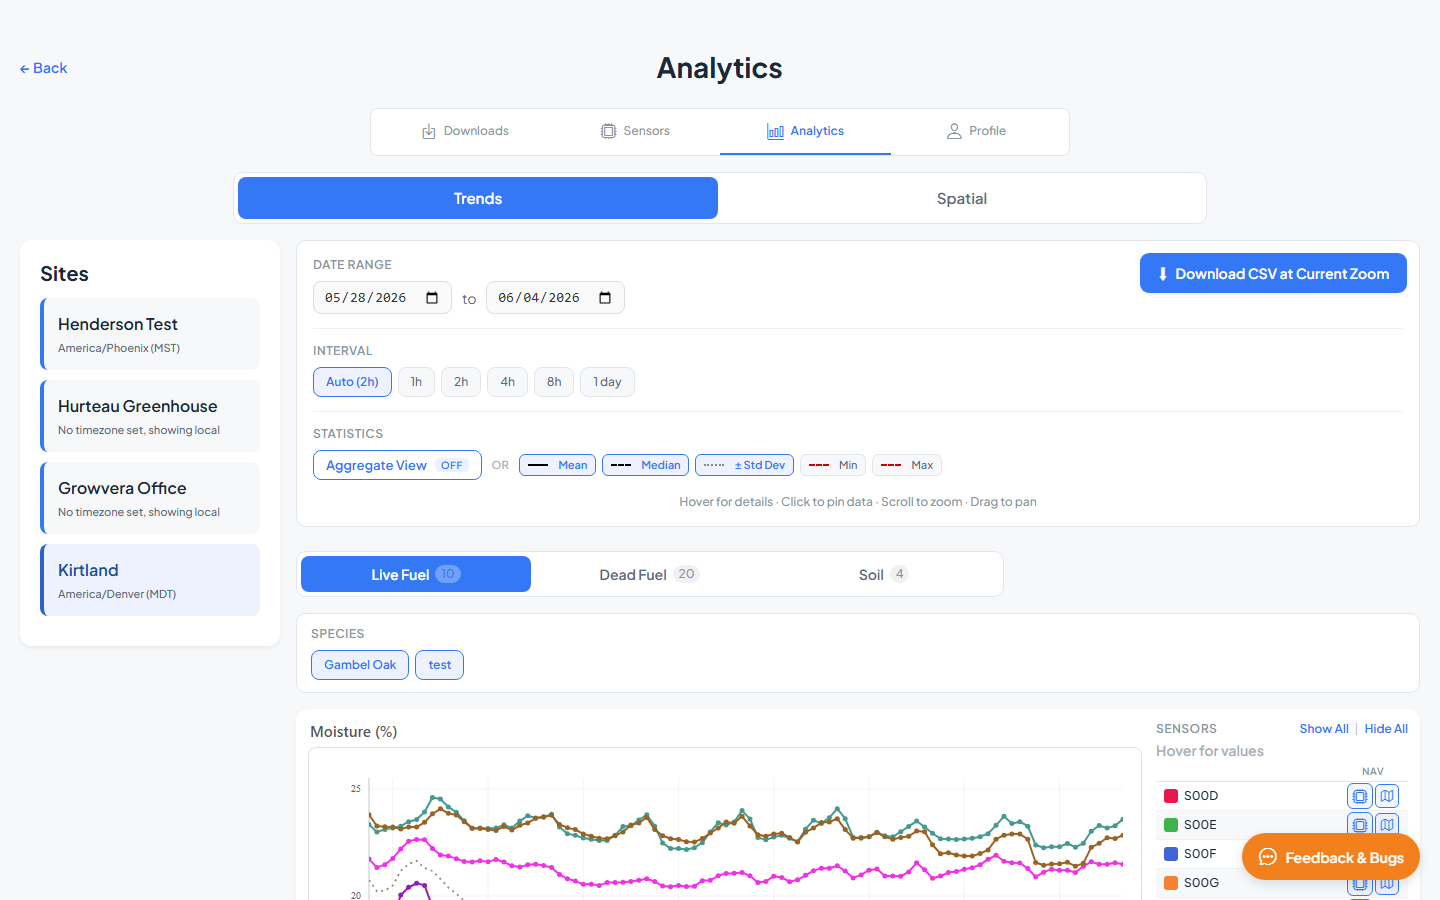
The Analytics page lets you explore measurement data across your sites. Select a site from the left column, then choose Trends or Spatial to view the data.
Sites column
The Sites list on the left shows every site in your organization. Click a site to load its data in the main panel. Each site card displays its timezone.
Trends view
Trends shows time-series charts for all sensors at the selected site. Use the controls panel to adjust the date range, sampling interval, and statistical overlays.
Filters and controls
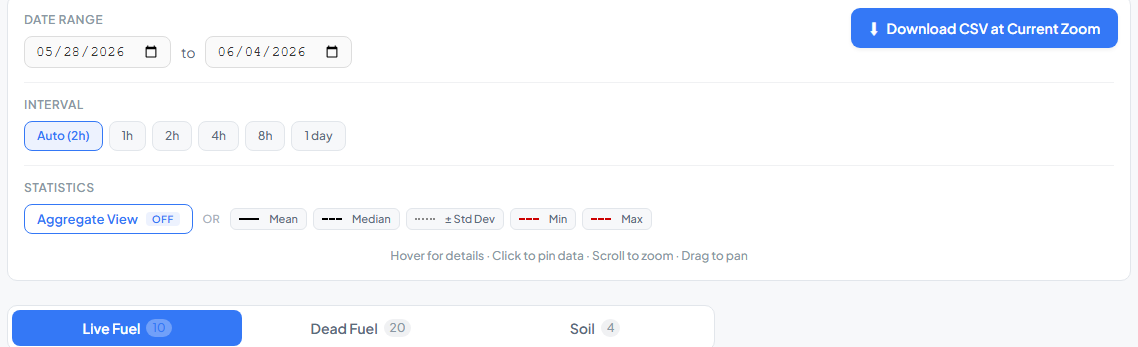
The controls panel at the top of Trends lets you shape what appears on every chart. Select a site first — controls apply to the active site only.
| Control | Options | Description |
|---|---|---|
| Date Range | Start and end dates | Select the period to analyze (maximum 30 days) |
| Interval | Auto, 1h, 2h, 4h, 8h, 1 day | Time between data points; Auto picks based on range length |
| Statistics — Rain | Toggle | Overlay rain periods from weather sensors (when available) |
| Aggregate View | On / Off | Show a single aggregated line across all sensors |
| Mean, Median, ± Std Dev, Min, Max | Toggle each | Statistical overlays on individual sensor lines (disabled when Aggregate View is on) |
With Aggregate View on, per-sensor statistics are unavailable because the chart shows one combined line.
Species and fuel class filters
Within each sensor-type tab, additional filter chips narrow which measurements are plotted:
| Tab | Filter | What it does |
|---|---|---|
| Live Fuel | Species | Show or hide individual live-fuel species groups |
| Dead Fuel | Fuel class | Toggle dead-fuel moisture classes (e.g. 10-hour, 100-hour) |
| Dead Fuel | Species | Further filter dead-fuel lines by species when multiple exist |
| Soil | Depth | Toggle soil water-potential depths on multi-probe sensors |
Enabled chips are highlighted; click a chip to hide that group from the chart. Charts and the legend update immediately.
Sensor type tabs
Charts are grouped by sensor type. Available tabs depend on which sensor types exist at the site:
| Tab | Measurements |
|---|---|
| Live Fuel | Live fuel moisture and related readings |
| Dead Fuel | Dead fuel moisture by fuel class |
| Weather | Temperature, humidity, VPD, wind speed, rain, and more |
| Soil | Soil moisture and water potential at configured depths |
| Other | Additional sensor types |
Exploring the chart
You can inspect and navigate trends directly on the chart:
| Action | What it does |
|---|---|
| Hover | Show measurement values at a point in time |
| Click | Pin values at that timestamp — pinned readings appear under Pinned in the chart legend |
| Scroll | Zoom in or out on the time axis |
| Drag | Pan left or right along the timeline (when zoomed in) |
Chart legend
| Legend section | Actions |
|---|---|
| Sensors | Show All / Hide All to toggle individual sensor lines |
| Pinned | Values pinned by clicking on the chart |
Click a sensor row in the legend to show or hide it.
Download CSV
On web, use Download CSV at Current Zoom to export the visible chart data. The file includes sensor alias, measurement values, and timestamps for the selected date range and zoom level.
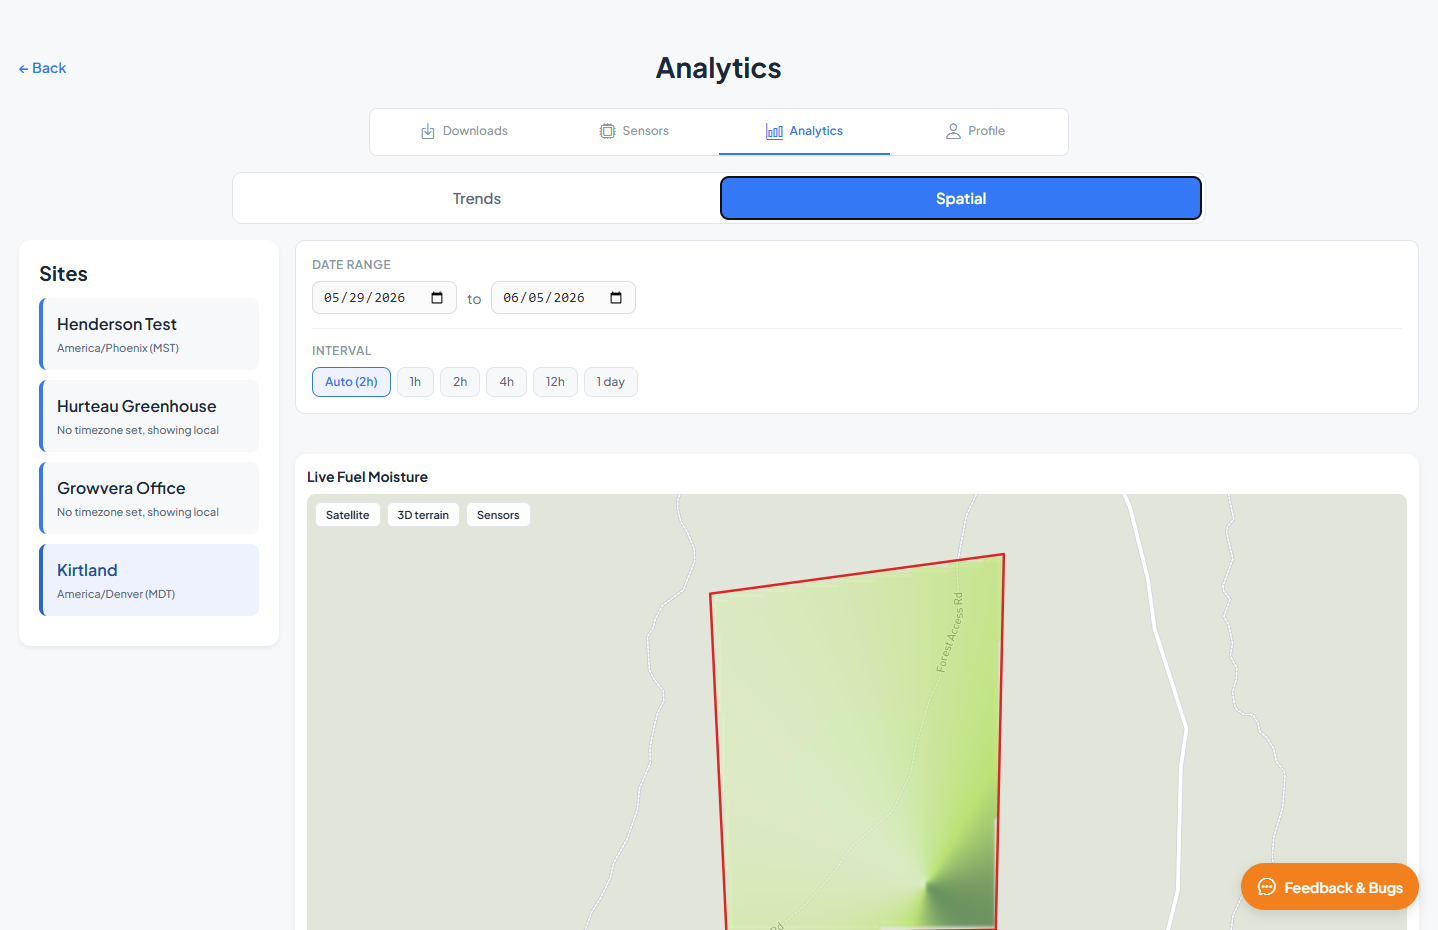
Spatial view
Spatial shows kriging-interpolated heatmaps of key variables across the site boundary over time. Use playback controls to animate changes through your selected date range.
Controls
| Control | Description |
|---|---|
| Date Range | Start and end dates for the spatial animation (maximum 45 days) |
| Interval | Time step between frames (Auto or fixed intervals) |
Variable cards
Each card shows an interpolated map for one variable:
| Variable | Description |
|---|---|
| Live Fuel Moisture | Interpolated live fuel moisture across the site |
| Dead Fuel Moisture | Interpolated dead fuel moisture |
| Temperature | Air temperature |
| Humidity | Relative humidity |
| VPD | Vapor pressure deficit |
Each card includes a heatmap overlay on the site boundary, playback controls (1/2×, 1×, 4×, 8× speed), and a timestamp for the current frame.
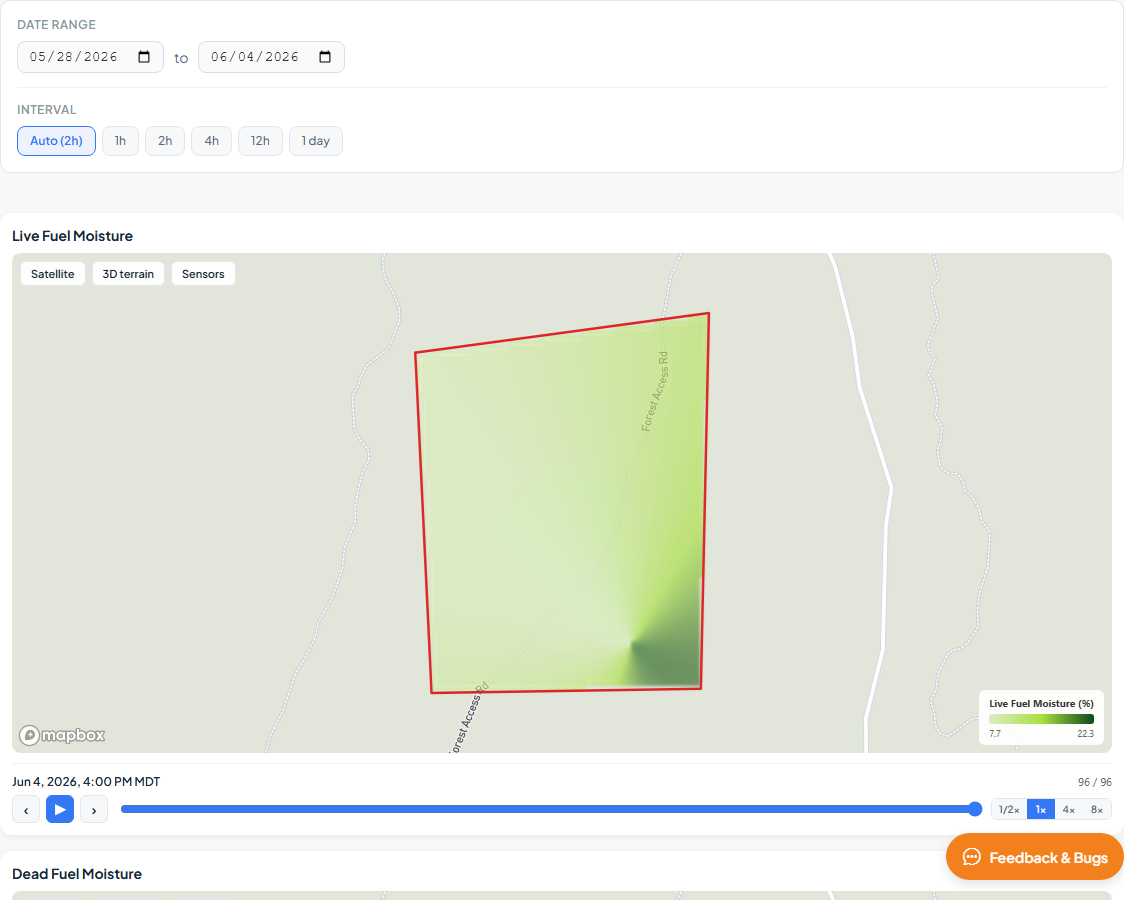
The map in each card is zoomed to the site boundary so you can read the interpolation pattern. Playback buttons advance through time steps at the selected speed.
Map toggles
Each variable card includes three map overlay toggles in the top corner:
| Toggle | Description |
|---|---|
| Satellite | Switch between street map and satellite imagery |
| 3D Terrain | Add terrain elevation for a three-dimensional view. When enabled, you can look around the site — on web, hold Ctrl and drag to rotate; on touch devices, use a two-finger pitch gesture. The map stays fixed to the site — you cannot pan or zoom to move around. |
| Sensors | Show or hide sensor marker locations on the heatmap |
Active toggles are highlighted. Click a toggle again to turn it off.
Related guides
- Map & Monitoring — live map with fuel moisture heatmap layer
- Downloads — export measurement data as CSV or GeoJSON