Web App Overview
The Dryline web app is a browser-based dashboard for monitoring fuel moisture sensors, viewing analytics, exporting data, and managing your deployment. No installation is required — open it in any modern web browser.
Last updated: June 2026
Access the app
Sign in at dryline.growvera.com using the email and password provided for your organization.
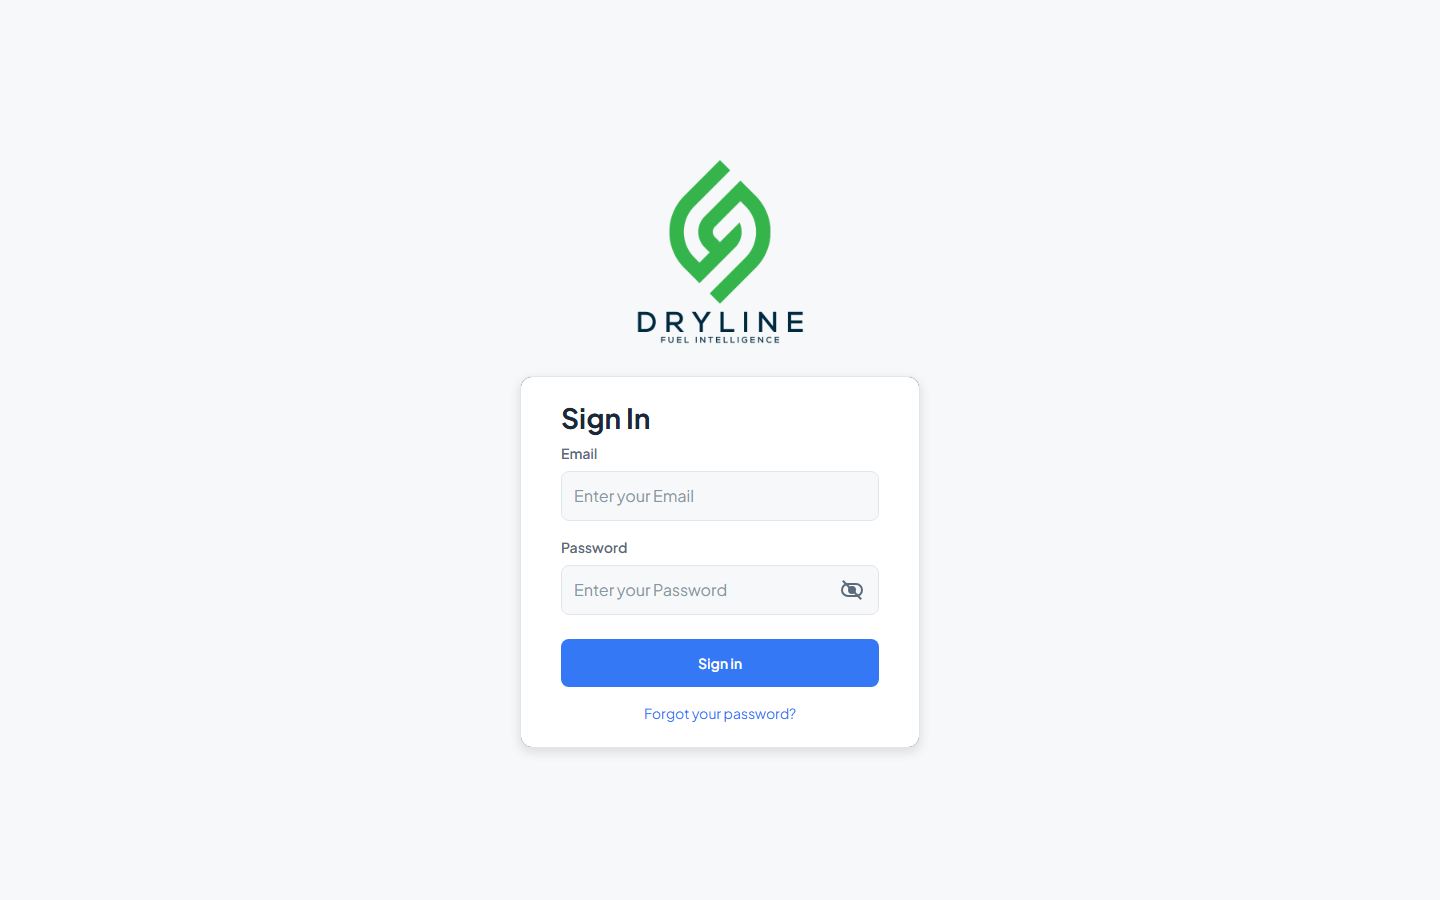
Signing in
Enter your email and password, then click Sign In. You will be prompted for a two-factor authentication code on every sign-in.
| Action | How |
|---|---|
| Reset password | Click Forgot your password?, enter your email, and follow the reset code flow |
| Two-factor authentication | After entering your password, enter the Verification Code from your authenticator app |
| Set up 2FA | On your first sign-in, scan the QR code with your authenticator app and confirm with a verification code |
Navigation
After signing in, you land on the Home map — the main monitoring view. From there you can reach every other area of the app.
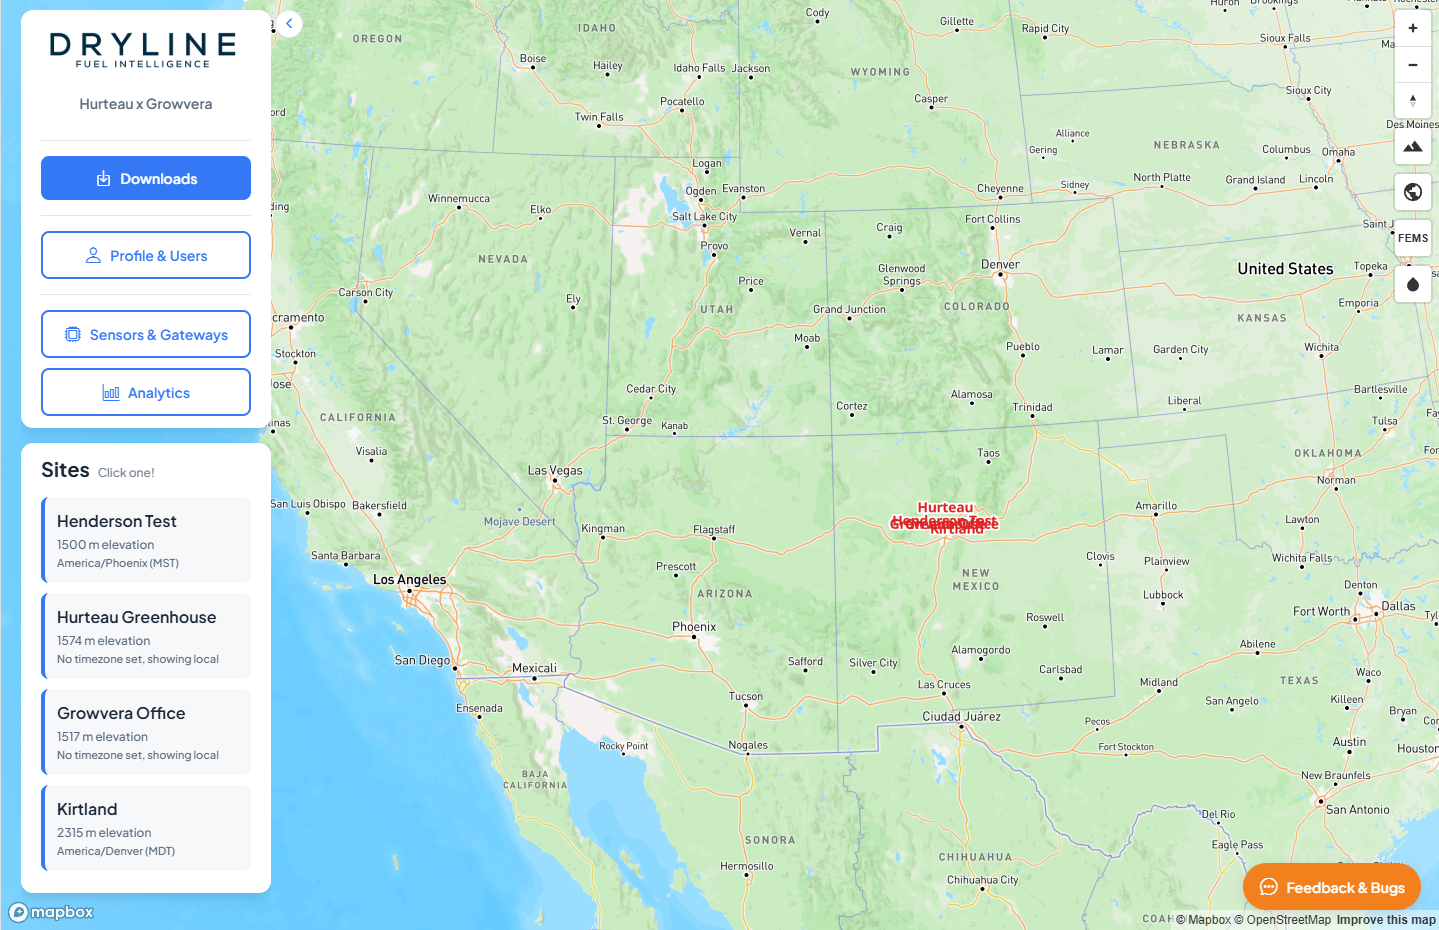
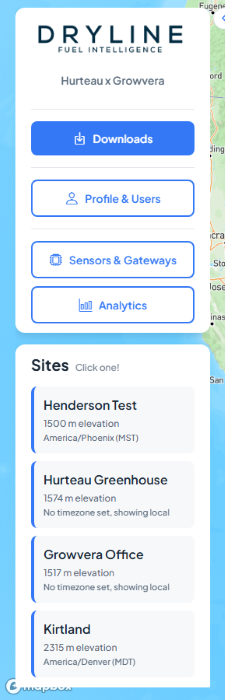
Home left panel
The collapsible panel on the left side of the map provides quick access to all major sections:
| Button | Opens |
|---|---|
| Downloads | Data export page |
| Profile & Users | Profile settings, API access, and organization directory |
| Sensors & Gateways | Fleet management for sensors and LoRaWAN gateways |
| Analytics | Trends and spatial analytics |
| Sites | Click a site card to zoom the map to that location |
Minimize the panel with the chevron button; a menu button in the corner expands it again.
NavStrip (secondary pages)
When you open Downloads, Sensors, Analytics, or Profile, a horizontal tab bar appears below the page header:

| Tab | Page |
|---|---|
| Downloads | Export calibrated measurement data |
| Sensors | Sensors & Gateways |
| Analytics | Trends and spatial views |
| Profile | Profile & Users |
Use ← Back to return to the previous page or Home.
Guide sections
- Map & Monitoring — interactive map, layers, and sensor popups
- Sensors & Gateways — fleet overview, gateway details, and sensor editing
- Analytics — time-series trends and spatial heatmaps
- Downloads — export data as CSV or GeoJSON
- Profile & API — units, OGC API access, and organization users
Feedback & Bugs
Every page includes a Feedback & Bugs button in the lower-right corner.
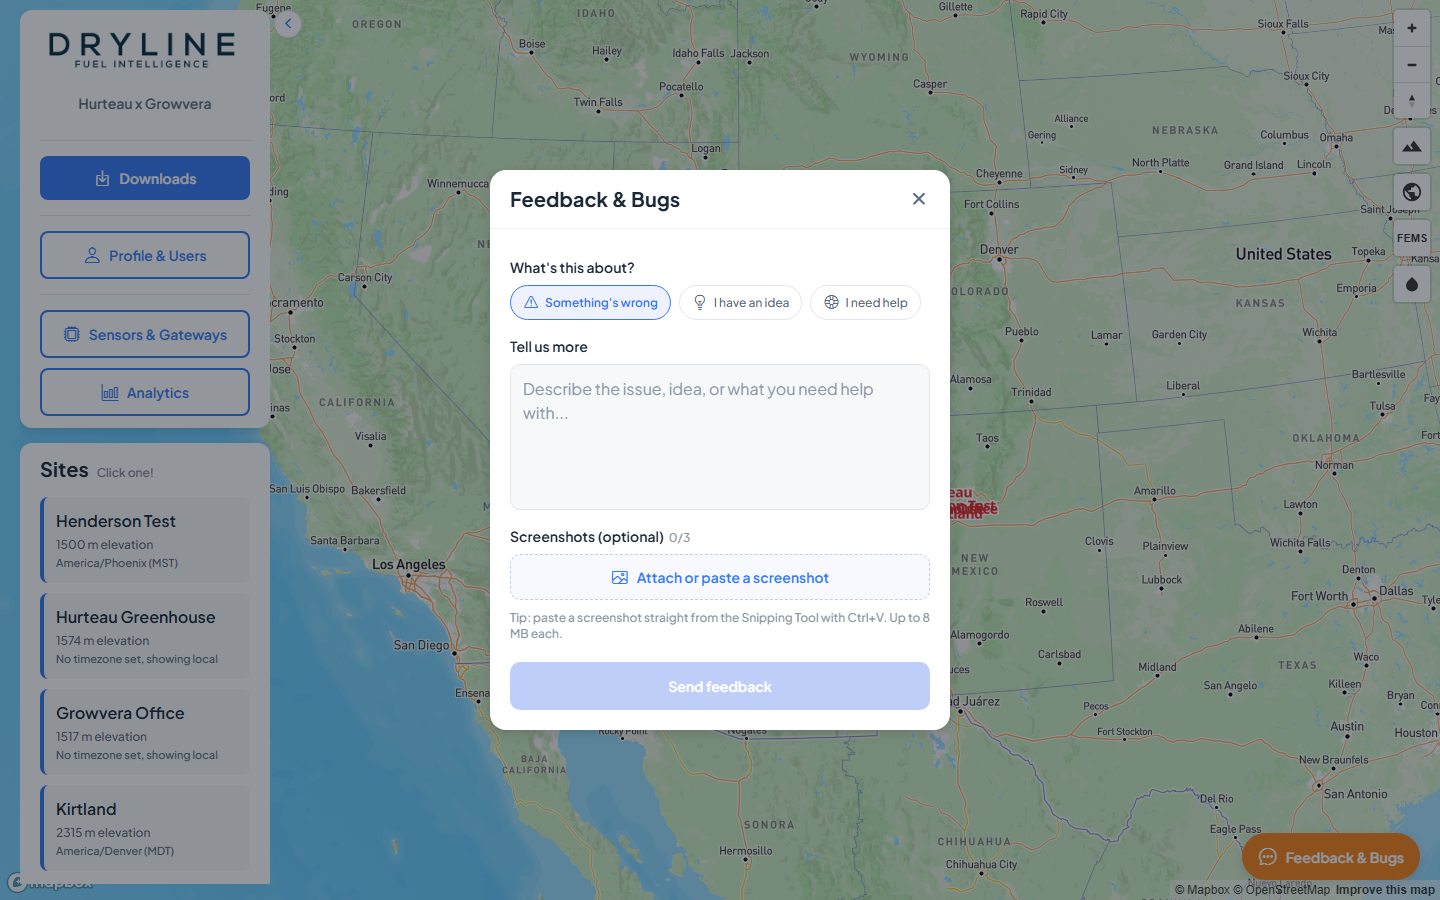
- Click Feedback & Bugs
- Choose a category: Something’s wrong, I have an idea, or I need help
- Describe your issue or suggestion
- Optionally attach screenshots
- Click Send feedback
Your message is sent to the Growvera team along with basic diagnostic information to help us investigate.