Map & Monitoring
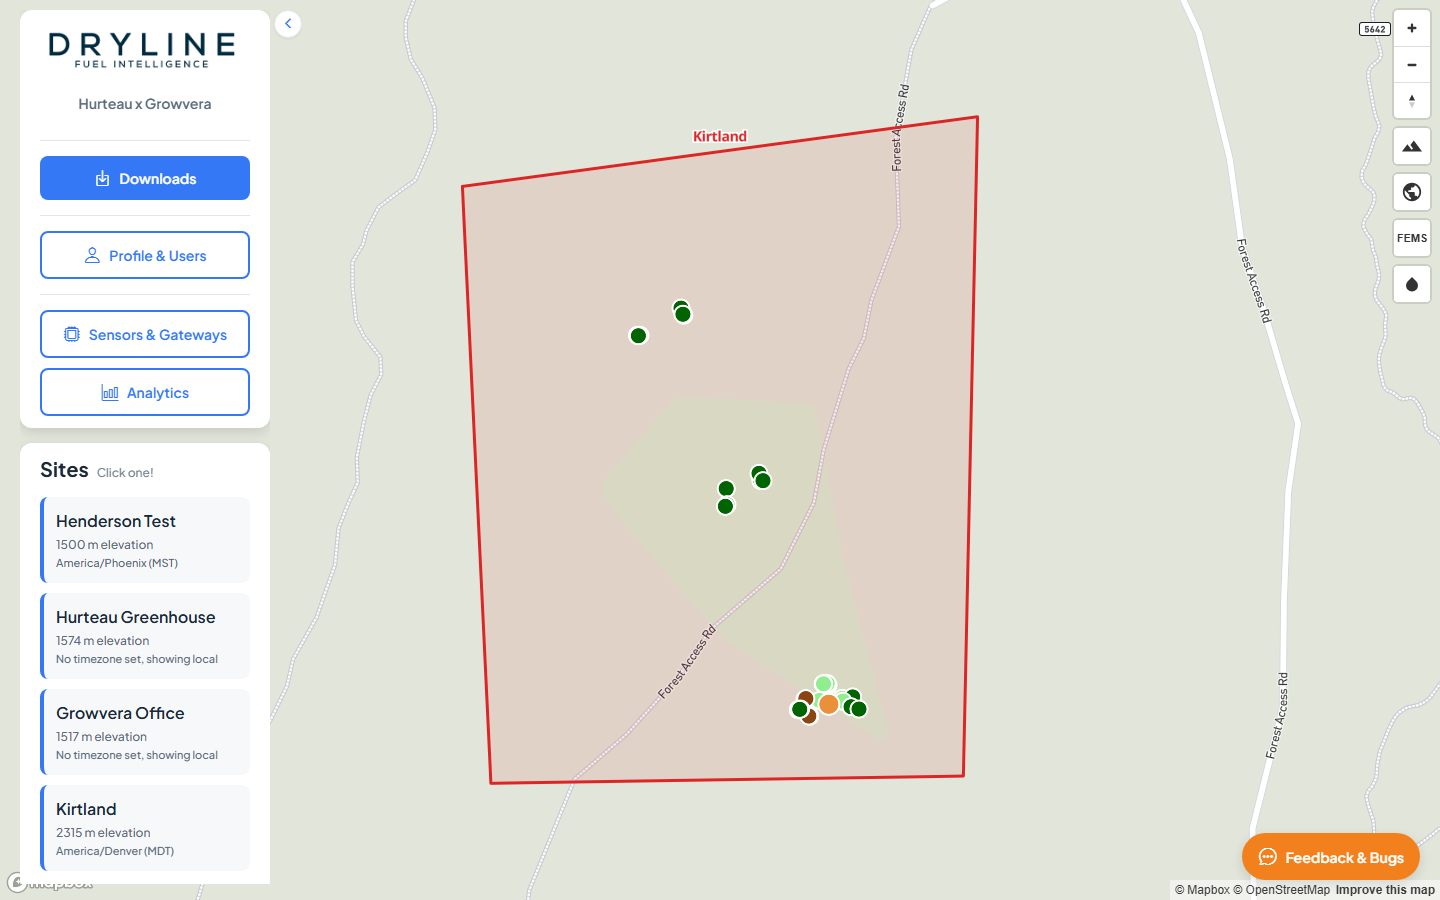
The Home map is your primary monitoring view. It shows sensor and gateway locations, site boundaries, and optional data overlays for your entire deployment.
Sites panel
The Sites list in the left panel shows every site in your organization. Click a site card to zoom the map to that area.
| Site card info | Description |
|---|---|
| Site name | Display name for the deployment area |
| Elevation | Site elevation above sea level |
| Timezone | The timezone used for analytics on this site. Most of the time, it will be automatically assigned based off of the location of the site. |
Map layers
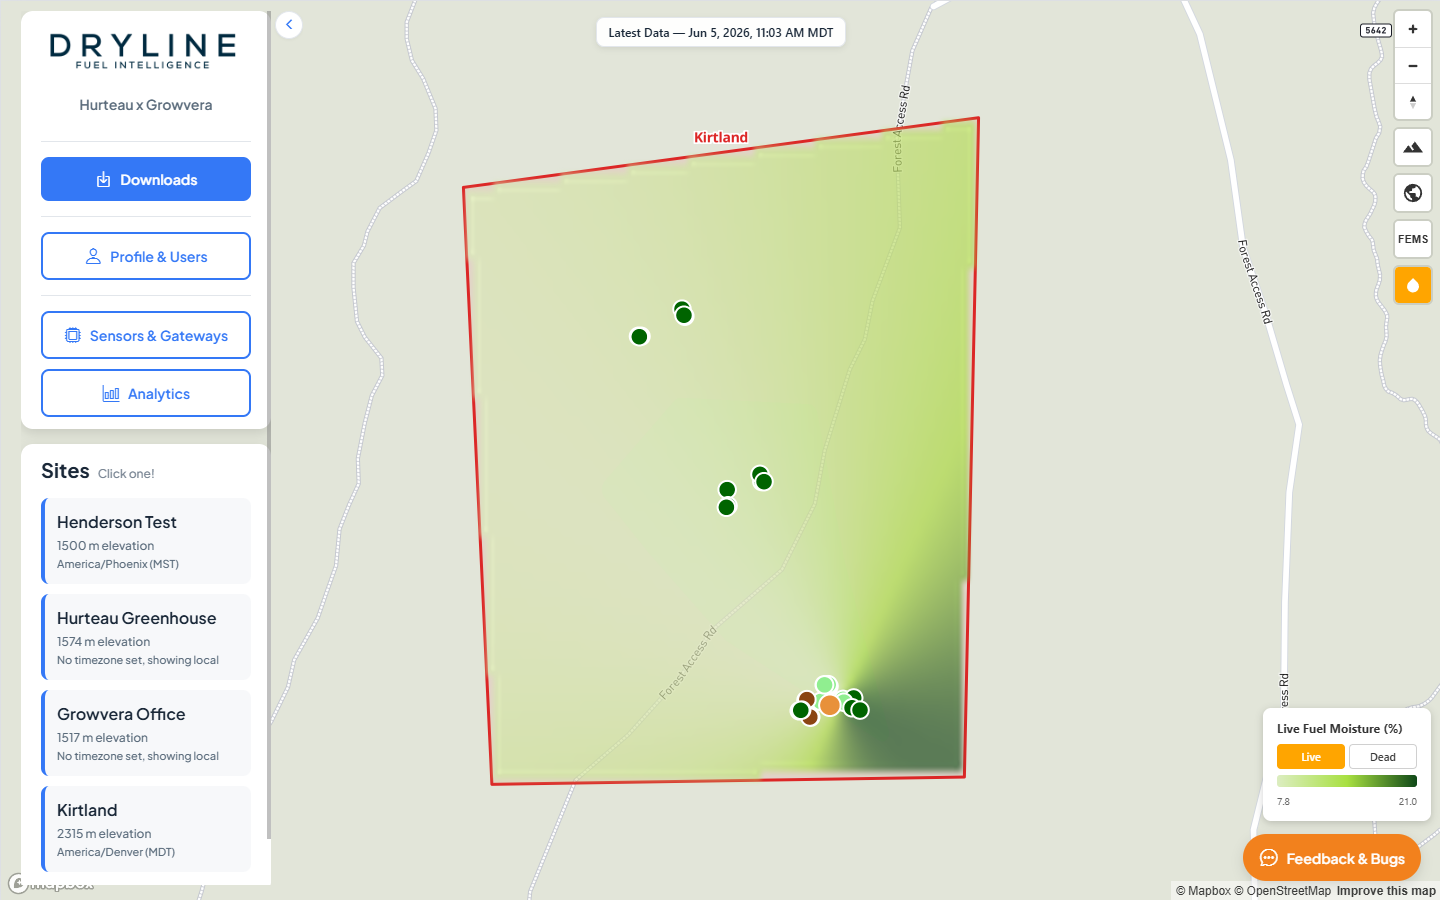
Map controls appear as buttons on the map. Hover each button to see its tooltip.
| Icon | Control | Description |
|---|---|---|
 | 3D Terrain | Toggle terrain elevation for a three-dimensional view |
 | Satellite View | Switch between street map and satellite imagery |
 | FEMS Data | Overlay FEMS (Fire Effects Monitoring System) sample points |
 | Fuel Moisture Heatmap | Display a kriging interpolation of fuel moisture across the site |
Active layer buttons turn orange. Click the button again to turn the layer off.
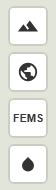
Fuel Moisture Heatmap
Enabling Fuel Moisture Heatmap renders a spatial interpolation of moisture values across your site boundary. Select a site first so the map zooms to the correct area, then toggle the heatmap button.
When the fuel moisture heatmap is active, a Latest Data badge shows the timestamp of the most recent interpolation data.
Click anywhere on the heatmap to see interpolated values at that location.
The heatmap on the home page supports live fuel moisture and dead fuel moisture, which can be selected in the bottom right corner. Other data is available in the analytics tab.
Sensor popups
Click a sensor marker on the map to open a popup with recent readings and mini charts.
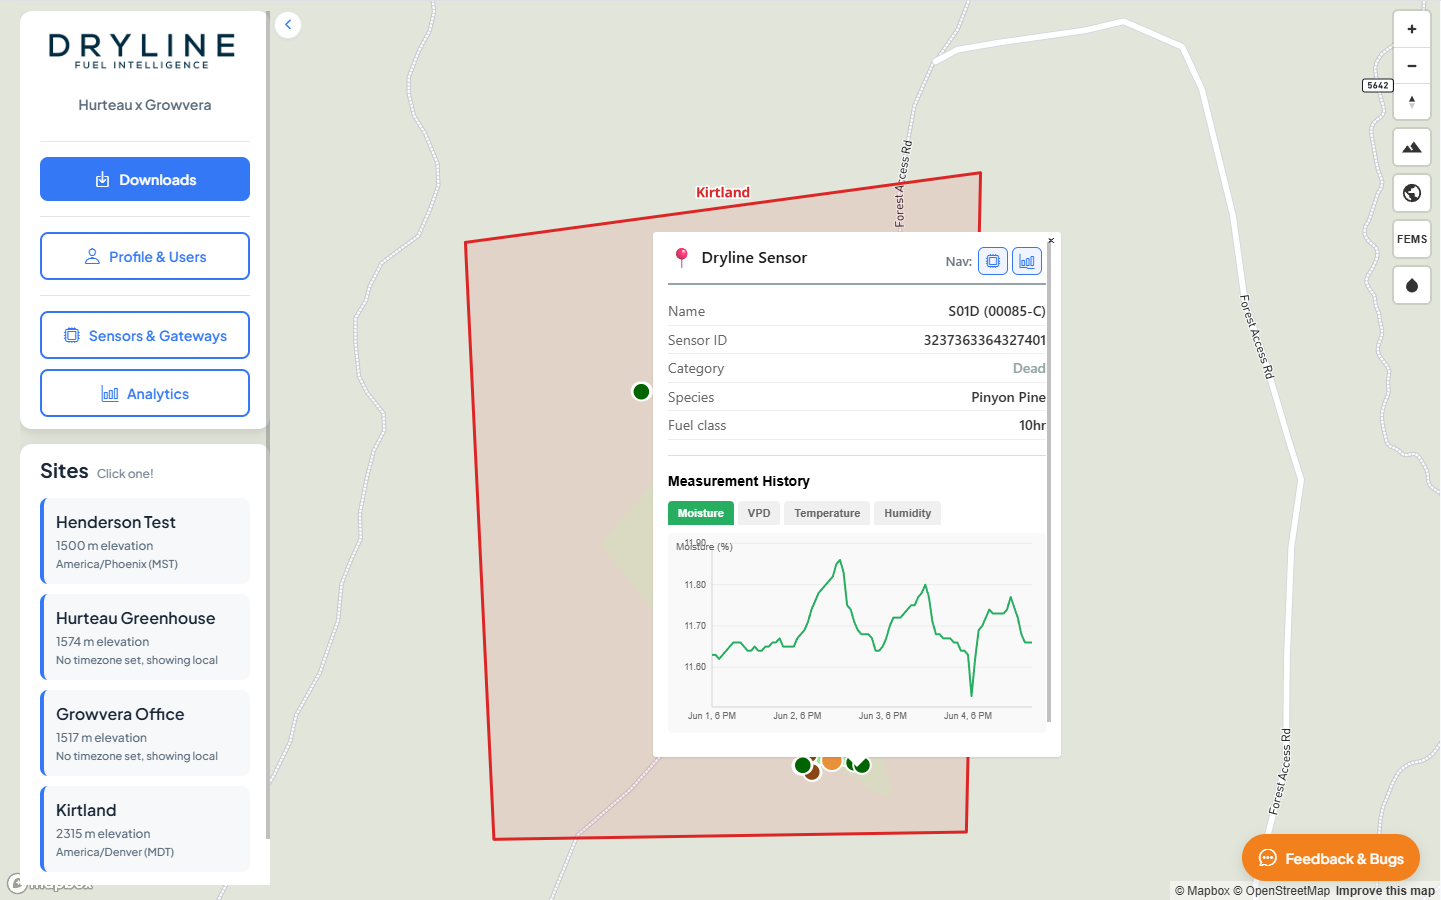
| Popup element | Description |
|---|---|
| Mini charts | Recent trend for key measurements (Time is in the site’s timezone) |
| Sensors icon | Jump to this sensor on the Sensors & Gateways page |
| Analytics icon | Open Analytics for this sensor’s site and sensor type |
Gateway markers
Gateway locations appear as separate markers on the map. Gateways relay data from LoRaWAN sensors to the cloud. See Sensors & Gateways for gateway details.
FEMS data points
With FEMS Data enabled, historical FEMS sample locations appear as points on the map. Click a point to open a popup titled FEMS Data Point with sample metadata.
Related guides
- Sensors & Gateways — edit sensor locations and view gateway health
- Analytics — detailed time-series and spatial analysis